
Unit 1 – Voting Behaviour: Evaluate the view that age is the most significant determinant of voting behaviour in UK elections?
The answer to this question is a resounding yes! Age is undoubtedly the more reliable indicator of how people will vote in UK elections.
The older the voter, the more likely they are to cast their ballot for the Conservative Party. The YouGov polling below shows this perfectly with the percentage of people voting Conservative increasing with each age bracket, culminating with 46% of voters aligning with the Conservative Party at the 2024 general election. The reverse is true for Labour with their proportion of the vote declining as people get older. In 2024, 45% of 25–29-year-olds voted Labour whereas just 20% of those aged 70+ voted for the party.

2024 YouGov Poll
The cross over point where voters begin to switch allegiances from Labour to the Conservatives was measured at 42 years old at the 2024 election, an increase from the 2019 election when the average age at which voters crossed over was 39 years old. At the 2019 election, if only 18–24-year-olds had been allowed to vote, the Conservative would have won no seats in the country at all apart from in parts of Essex and The Wash. Conversely, if only those aged 65 or over had been allowed to vote, the only Labour seats would have been in parts of London and other towns in the Midlands and the northwest of England. Age now clearly has a much more significant impact on voting behaviour than many other factors.
This can be seen particularly in the chart below which shows that gender has very little influence on how people voted in 2024. There was only a limited difference between the percentages of men and women from the same age bracket who voted Labour, for example 32% of men and 32% of women between the ages of 50-64 voted Labour in 2024. There is a slight difference in the impact of gender however and this was that men were far more likely to vote for the Reform Party then women were. This tendency for men to vote for more far right parties was a trend that has been seen throughout recent elections in Europe and the 2024 UK election was not exempt from this. In fact, whilst 12% of young men voted for Reform, just 6% of women did. Compare this to the 23% of young women who voted for the Green Party compared to just 12% of men and it appears that an interesting trend in which young men and women appear to be diverging towards different ends of the political spectrum is taking place. Nonetheless, it is clear to see that by and large the same proportion of men and women in each age bracket vote for Labour or the Conservatives, with the overall proportion voting Labour decreasing as voters get older. Therefore, the clearest indication of an individuals voting intention remains their age rather then their gender.

YouGov Poll showing 2024 Election vote by gender
Before the end of the 20th Century, the clearest determinant of how a person would vote was their class. Working class voters tended to vote Labour and Middle- and Upper-class voters tended to vote Conservative. Class has become less important as a determinant of how people will vote however. In 2024, there was almost no difference between classes. Those in the AB class (managerial and professional classes) were only slightly more likely to vote Labour then those in the DE class (manual workers, pensioners and the unemployed). In fact, the better your social class, the more likely you were to vote either Labour or Conservative. As with men, the differences between classes was that those in manual professions were more likely to vote Reform than white collar, office workers. However, class is interesting because the 2024 election did not align with previous ideas about the voting intentions of each class of voter. For example, in the 2010 election, 39% of AB voters voted Conservative compared to just 26% for Labour whereas 40% of DE voters voted Labour compared to 31% for the Conservatives. Moreover, in 2019, Labour received an almost identical percentage of the vote from the differing social classes as they did in 2024. The only difference within the Conservative vote in 2019 as compared to 2024 was the emergence of the Reform Party. In fact, had Reform stood in as many seats in 2019 as they did in 2024 than it is likely that the Conservatives would have received a far lower number of votes. Class is therefore a poor predictor of how people will vote although it does appear that those in the C2DE class are more likely to vote Reform. Given that the C2DE class includes pensioners we could claim some correlation between this class and age. We could assume therefore that once again, age is a much better predictor of how people will vote than class.

YouGov Poll showing 2024 vote by Social Class.
One of the most significant voting trends of recent years has been in education levels. Continuing a trend first apparent in the 2016 EU referendum and then repeated in 2017 and 2019, education appears to be a key indicator of voting behaviour, but not in the way we might expect. The higher the educational qualifications of the voter, the more likely they are to vote Labour or Liberal Democrat, with 60% of those educated to degree level or higher voting for one of those two parties in 2019, compared with only 29% voting Conservative. For those educated to GCSE level or below, the reverse was the case, with a combined vote share for Labour and the Liberal Democrats of 33% versus 61% for the Conservative and Brexit parties. This is a change in voting behaviour as less well-educated voters traditionally voted Labour, and now appears to be a trend and was repeated in 2024. Interestingly, we might be able to make some link between education levels and age. Given that so many more people have begun attending university since the mid 90s, it is perhaps to be expected that the qualifications held by young people are generally higher than those of people in the older age brackets. Once again, we should point towards age as a key factor in determining how people vote.
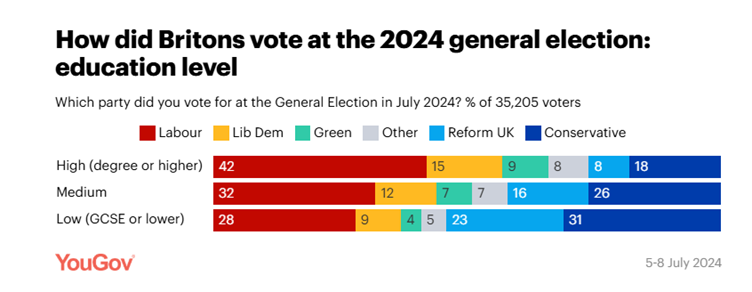
YouGov Poll showing 2024 vote by education levels
At the 2019 election, there was much talk about a shift in voting geographically. The Conservatives captured much of the so called ‘red wall’ in the north of England that had traditionally voted Labour. Labour’s voted meanwhile appeared to be concentrated on the inner cities of England. In the 2024 election, the idea that geography might become a new determinant in how people voted was dispelled. The Conservatives not only lost the seats that they had gained in the Red Wall, but they also made significant losses in the so called ‘blue wall’ in the south England, predominantly to the Liberal Democrats. Therefore, it would probably be better to recognise that geography bears little impact on how people vote and is instead more linked to other national trends. For example, the losses made by the Conservative Party in the north of England were far more determined by older voters abandoning the party for Reform and the professional classes abandoning them for the Liberal Democrats in the South.
Conclusion
Everything points to age as the clearest indicator of an individuals voting behaviour. As a person gets older we see that they move from left to right wing parties and this phenomenon has replaced class as the most obvious clue to their voting behaviour. Nonetheless, an interesting point to note is that new signposts are emerging. Education has become a far more reliable indicator of how a person will vote whereas young men and women are beginning to diverge, with women moving towards the left and men towards the right. Perhaps it is too early to tell but these might become even more valuable clues towards a persons voting intention in the future.
For futher help with this question then please take a look at the YouGov website which has an endless array of statistics on the 2024 and other UK elections.